Abstract
The present study aims to examine the role of socio-demographic factors in parent–child relationships and mental health among 350 school-going children in Amritsar, Punjab. Socio-economic circumstances provide an important context for understanding children’s psychological well-being, as disadvantaged socio-economic conditions have been associated with a greater likelihood of mental health problems among children and adolescents (Reiss, 2013). Similarly, the World Health Organization and United Nations Children’s Fund (2021) emphasise supportive environments and assistance to parents and caregivers as important components of adolescent mental health promotion. Against this background, the proposed study will adopt a quantitative, descriptive, and correlational research design. Primary data will be collected through a structured socio-demographic questionnaire and age-appropriate standardised measures of parent–child relationships and mental health. Age, gender, class level, family type, parental education, parental occupation, and family income will represent the selected socio-demographic characteristics. The assessment of parent–child relationships will consider communication, emotional support, parental involvement, acceptance, and conflict, subject to the dimensions of the selected instrument. Mental health will be examined through indicators of psychological well-being and emotional and behavioural difficulties. Frequencies, percentages, means, and standard deviations will summarise the respondents’ profiles and study variables. Correlation analysis will examine the relationship between parent–child relationship quality and mental health, while t-tests and analysis of variance will assess differences across relevant socio-demographic groups. Multiple regression analysis will examine the contribution of selected socio-demographic characteristics and parent–child relationship quality to variations in mental health. The study seeks to provide locally relevant evidence to inform school counselling, parental awareness programmes, and family support initiatives for school-going children in Amritsar, Punjab.
- Socio-Demographic Factors
- Parent–Child Relationship
- Mental Health
- School-Going Children
- Parental Support
- Family Environment
- Amritsar
- Punjab
INTRODUCTION#
Children’s mental health is an important foundation for their learning, social adjustment, and overall development. During the school years, children encounter changing academic expectations, friendships, family responsibilities, and emotional experiences. Understanding their well-being therefore requires attention to both their individual characteristics and the environments in which they grow. The World Health Organization (WHO, 2025) identifies adolescence as a formative period during which physical, emotional, and social changes can increase vulnerability to mental health difficulties. Globally, approximately one in seven individuals aged 10–19 years experiences a mental disorder. This estimate concerns adolescents worldwide and should not be interpreted as the prevalence among school-going children in Amritsar. Nevertheless, it establishes the wider importance of examining the circumstances associated with young people’s mental health.
The parent–child relationship is a central aspect of the family environment. It includes the ways in which parents and children communicate, express affection, provide and receive support, establish expectations, and manage disagreements. Understanding this relationship involves examining children’s experiences of being listened to, accepted, guided, and respected. Hsieh et al. (2023) investigated family functioning through dimensions such as parent–adolescent communication, family cohesion, parental support, monitoring, and supervision. Their approach demonstrates the value of considering several aspects of family interaction together. For the present study, this perspective provides a basis for examining relationship quality beyond the simple presence of parents in the household. The relevant question is how children experience their everyday interactions with their parents.
Parenting practices and children’s psychological difficulties have also been examined within Indian school settings. Makwana et al. (2023), in a cross-sectional study involving 480 students in Valsad, Gujarat, reported associations between parenting styles and children’s scores on the Pediatric Symptom Checklist. Authoritarian parenting was associated with poorer mental health indicators, while consistency between parents was associated with lower difficulty scores. These findings support the relevance of studying parental interactions alongside children’s emotional and behavioural functioning. However, cross-sectional associations do not establish that parenting alone causes psychological difficulties. In the Amritsar study, parent–child relationship quality will therefore be treated as a factor to investigate rather than as a predetermined explanation for every mental health concern.
Socio-demographic factors provide another important dimension of this investigation. These factors describe children’s personal and family circumstances, including age, gender, class level, family type, parental education, parental occupation, and household income. Reiss (2013), in a systematic review, identified an association between socio-economic disadvantage and mental health problems among children and adolescents. This evidence suggests that mental health should be considered within the wider context of access to resources and family circumstances. For the present investigation, socio-demographic information will help establish whether patterns in parent–child relationships and mental health differ across groups. Such comparisons can make the analysis more informative than an overall average that combines children with substantially different backgrounds.
Household income, parental education, and occupation need to be examined as distinct characteristics, even though they may be related. Income describes the financial resources available to the family; education captures an aspect of parents’ educational background; and occupation provides information about their employment circumstances. None of these characteristics should automatically be treated as a measure of parental affection or commitment. Indeed, Makwana et al. (2023) found an association between maternal education and children’s well-being but did not find a statistically significant association between socio-economic status and either parenting style or children’s psychological difficulty scores in their sample. Read alongside Reiss (2013), this finding indicates that relationships observed across the broader literature may not appear identically in every setting. Local investigation is therefore necessary before drawing conclusions about children in Amritsar.
Age and gender are also relevant to the proposed analysis because children’s developmental circumstances and experiences may differ across these categories. However, the direction of any difference should remain an empirical question. Hsieh et al. (2023) found that associations between adolescent gender and reported family functioning varied across Mumbai and Kolkata and according to whether the respondent was a parent or an adolescent. Their findings illustrate why demographic categories require careful interpretation. The Amritsar study will accordingly examine whether differences occur within its own sample, without assuming beforehand that one gender necessarily experiences better relationships or mental health. Similarly, age and class level will help situate responses within the children’s stage of schooling.
Family type will be considered as a background characteristic rather than an automatic indicator of relationship quality. Recording whether children live in nuclear, joint, or other family arrangements can describe their household context, but the study must also examine their reported experiences within those arrangements. A family category alone cannot answer whether a child feels supported or comfortable discussing concerns. This distinction is important for the proposed research because its focus is on both socio-demographic circumstances and the quality of parent–child relationships. The analysis will therefore seek to understand variations within groups as well as differences between them, avoiding broad conclusions that label an entire family arrangement as favourable or unfavourable. The school context adds practical significance to the investigation. WHO (2025) notes that emotional disorders can interfere with school attendance and schoolwork and identifies supportive family, school, and community environments as important for adolescent well-being. Schools consequently offer a relevant setting for understanding children’s experiences while considering how educational and family support can work together.
REVIEW OF LITERATURE#
Vadageri (2026) examined the impact of socio-economic conditions and school type on adolescent mental health in India through a quantitative descriptive design. The study compared adolescents from private and government schools and found that respondents from private schools reported better psychological well-being, while public-school respondents from comparatively weaker socio-economic backgrounds showed lower well-being and greater psychological distress. The findings highlighted the importance of socio-economic conditions and school type in understanding adolescent mental health. This study is particularly relevant to the present research because school type and socio-economic background are important socio-demographic variables.
Wentholt et al. (2026) conducted a meta-analysis examining observed parent–child interaction behaviours in relation to childhood and adolescent depression. The review synthesized 90 studies and found that lower parental warmth and support and greater harsh control or criticism were associated with higher levels of depression. Longitudinal evidence also suggested that these negative parenting behaviours could precede depressive symptoms. The study emphasized that the actual quality of parent–child interaction is an important factor in children’s psychological well-being.
Sun et al. (2025) conducted a meta-analysis of 63 studies involving 70,687 participants to examine parent–child closeness, conflict, and childhood depression. Parent–child conflict showed a positive association with depressive symptoms, whereas parent–child closeness was negatively associated with depression. The magnitude of these relationships differed according to age, culture, and study design, although child gender was not a significant overall moderator. The findings provide strong evidence that supportive parent–child relationships operate as a protective factor for children’s mental health.
Xu and Ren (2025) analysed China Education Panel Survey data to examine parent–child relationship, parental control, and adolescent mental health. Better parent–child relationships were associated with fewer mental-health problems, while parental control influenced this relationship differently depending on the quality of the existing parent–child bond. The study also reported gender differences, with the moderating effect of parental control being more pronounced among girls. Family economic status and parental education were also associated with mental-health outcomes, making the study especially relevant to socio-demographic comparisons.
Li, Qian, and Liu (2025) conducted a four-wave longitudinal study of 951 adolescents to examine how both the quality and changes in parent–child relationships influence depression. Higher relationship quality was associated with lower depression, whereas deterioration or instability in the relationship was associated with increased depressive symptoms. The effects also varied according to interpersonal sensitivity and gender. The study demonstrates that both stable supportive relationships and demographic characteristics such as gender need to be considered while examining adolescent mental health.
Gautam et al. (2024) investigated socio-economic inequalities in child and adolescent mental health in Australia, with particular attention to parenting style and the parents’ couple relationship. Using longitudinal data, the researchers found that poor parenting style made a major contribution to socio-economic inequalities in mental health, especially among children from lower socio-economic backgrounds. Household income, maternal education, employment status, and couple relationships also contributed to mental-health differences. The study therefore supports examining income, parental education, occupation, and family relationships together rather than independently.
Liao, Chen, Liu, and Guo (2024) studied 20,629 elementary school children aged 9–13 years to compare the effects of family and school interpersonal relationships on depression. Family relationships, including father–child and mother–child relationships, showed stronger effects on depression than school relationships. Academic stress partially mediated these associations, while self-esteem moderated some effects. The findings reinforce the importance of studying parent–child relationship as a major determinant of mental health among school-going children.
Jia, Li, and Xie (2024) used a two-wave longitudinal design with 1,967 boarding high-school students to study parent–child relationships and later internalizing and externalizing problems. Both mother–child and father–child relationships influenced psychological adjustment through academic buoyancy and academic engagement. The mother–child relationship showed a somewhat stronger association with mental-health problems than the father–child relationship. The study shows that parental relationships remain important even when children spend substantial time in school or residential educational settings.
Yuan, Zhou, and Kang (2023) examined family socio-economic status and adolescent mental-health problems during the COVID-19 period in a longitudinal sample of 1,582 Chinese adolescents. Family SES was significantly related to anxiety, depression, and externalizing problems. Trait mindfulness and perceived stress acted as mediating mechanisms linking socio-economic background with mental health. The findings indicate that family economic conditions can shape children’s psychological functioning through both environmental stress and individual coping processes.
Yang, Hu, and Li (2022) investigated family socio-economic status and adolescent mental health using 7,234 observations from the China Education Panel Survey. Family SES showed a significant association with adolescents’ mental health, and the researchers separately considered family income, parental education, and parental occupation. Differences were also observed according to residential status and participation in health-related education. The study demonstrates the value of analysing individual socio-demographic dimensions instead of treating SES as a single undifferentiated factor.
Barnhart, Garcia, and Karcher (2022) examined family economic hardship, adverse childhood experiences, family conflict, and adolescent mental health using data from 5,510 young participants. Lower family economic status predicted greater externalizing difficulties, while adverse childhood experiences contributed to both internalizing and externalizing symptoms. Family conflict further intensified some of these relationships. This study indicates that economic disadvantage and the emotional quality of the family environment may operate together in shaping children’s mental-health outcomes.
Wang et al. (2021) investigated depressive symptoms among 6,435 Chinese adolescents during school closures and examined whether parent–child relationship modified the effects of academic problems. Depressive symptoms were more severe among children reporting study difficulties, and these associations were substantially stronger among adolescents with poor parent–child relationships. The study concluded that a supportive parent–child relationship may protect children against the psychological effects of educational stress. These findings are relevant to school-going children because family support may influence how they cope with academic pressures.
Liu, Ge, and Jiang (2020) used longitudinal data from 7,237 Chinese adolescents to examine changes in family relationships and mental health. Better marital relationships between parents and closer parent–child relationships were associated with better adolescent mental health. The effect of the father–child relationship differed according to whether the adolescent lived with the biological father. The study highlights living arrangement and family structure as important socio-demographic conditions influencing both family relationships and children’s psychological well-being.
Wu and Lee (2020) examined the effects of parent–child relationship and sex on internalizing symptoms from childhood to late adolescence. Longitudinal data were collected across ages 9, 12, 15, and 18 years. Girls showed greater internalizing symptoms and a faster increase in these difficulties, while a better parent–child relationship had an overall protective association with internalizing problems. The findings are important for the present study because they demonstrate that gender can influence mental-health patterns and should therefore be considered in socio-demographic analysis.
O’Gara et al. (2019) examined father–youth closeness and adolescent health using data from 3,321 fifteen-year-old adolescents. Greater father–child closeness was associated with better adolescent health, and mental health, measured through anxiety and depressive symptoms, explained an important part of this relationship. The pathways also differed between boys and girls. The study therefore supports examining both parental relationship quality and gender when studying the mental health of adolescents.
Zhang et al. (2018) analysed four waves of data from 1,126 secondary-school adolescents to study parent–adolescent and friend relationships in relation to depressive mood. Supportive relationships with parents and peers were associated with lower depressive mood, whereas conflictual relationships were associated with poorer psychological outcomes. The study showed that the emotional quality of relationships can change alongside fluctuations in adolescent mental health. It further confirms that parent–child relationship remains a major protective interpersonal factor during adolescence.
OBJECTIVES OF THE STUDY#
- To examine the socio-demographic profile of school-going children in Amritsar, Punjab.
- To investigate the relationship between parent–child relationship quality and mental health among school-going children.
- To examine the contribution of parent–child relationship dimensions in predicting mental health among school-going children in Amritsar, Punjab.
HYPOTHESES OF THE STUDY#
H₀₁: There was no significant relationship between parent–child relationship quality and mental health among school-going children in Amritsar, Punjab.
H₁₁: There was a significant relationship between parent–child relationship quality and mental health among school-going children in Amritsar, Punjab.
H₀₂: There was no significant contribution of parent–child relationship dimensions in predicting mental health among school-going children in Amritsar, Punjab.
H₁₂: There was a significant contribution of at least one parent–child relationship dimension in predicting mental health among school-going children in Amritsar, Punjab.
Research Design#
RESEARCH METHODOLOGY
The present study adopted a quantitative, descriptive, and analytical research design to examine the role of socio-demographic factors in parent–child relationships and mental health among school-going children in Amritsar, Punjab. The quantitative approach was appropriate because the responses of 350 school-going children were collected in numerical form and analysed using statistical techniques. The descriptive component was used to examine the socio-demographic profile of the respondents, including age, gender, family type, parental educational qualifications, parental occupation, and family income. It also helped describe the levels of parent–child relationship quality and mental health among the participating children. The analytical component was used to investigate the relationship between parent–child relationship quality and mental health and to examine their associations with selected socio-demographic factors. Differences in parent–child relationship quality and mental health across relevant socio-demographic groups were also examined. This research design provided a suitable framework for understanding the respondents’ background characteristics and identifying patterns and associations among the selected variables, without establishing cause-and-effect relationships.
Population and Study Area#
The population of the study consisted of school-going children in Amritsar, Punjab. Children belonging to different age groups, genders, family types, parental educational backgrounds, parental occupational categories, and family income groups were included in the study. Amritsar was selected as the study area to examine parent–child relationships and mental health among children from varied socio-demographic backgrounds within a defined geographical setting. The study included 350 school-going children and focused on their perceptions of parent–child relationship quality and their mental health. The selected study area provided the context for examining the association of children’s personal and family characteristics with the study variables. Each individual school-going child constituted the unit of analysis.
Sampling Design and Sample Size#
A stratified sampling design was adopted for the study. The population of school-going children in Amritsar, Punjab, was divided into strata based on selected socio-demographic characteristics. A total sample of 350 school-going children was included in the study. Within the selected strata, children from different age groups, genders, family types, parental educational backgrounds, parental occupational categories, and family income groups were covered to obtain responses from varied socio-demographic backgrounds. This sampling approach facilitated the examination of parent–child relationship quality and mental health across the selected groups.
Data Collection and Research Instrument#
Primary data were collected from 350 school-going children in Amritsar, Punjab, through a structured questionnaire developed according to the objectives and variables of the study. The questionnaire was divided into two sections. Section A included socio-demographic information, such as age, gender, family type, parental educational qualifications, parental occupation, and family income. Section B contained statements related to parent–child relationship quality and mental health. These statements were measured using a five-point Likert scale ranging from Strongly Disagree to Strongly Agree. The questionnaire was used to obtain systematic information about the respondents’ family relationships and psychological well-being and to examine their associations with selected socio-demographic factors.
Data Analysis Techniques#
The collected data were coded and analysed using SPSS. Descriptive statistics, including frequencies and percentages, were used to describe the socio-demographic profile of the 350 school-going children in Amritsar, Punjab. Means and standard deviations were calculated to summarise parent–child relationship quality and mental health scores. Pearson’s correlation analysis was applied to examine the relationship between parent–child relationship quality and mental health. Independent-samples t-tests and one-way analysis of variance (ANOVA) were used, as appropriate, to examine differences in these scores across socio-demographic groups. Multiple regression analysis was used to examine the associations of selected socio-demographic factors with parent–child relationship quality and mental health, with categorical predictors appropriately coded. A significance level of 0.05 was adopted for statistical interpretation.
Ethical Considerations#
The study maintained the privacy and confidentiality of all participating school-going children in Amritsar, Punjab. Participation was voluntary, and the academic purpose of the study was explained in language appropriate to the children’s age and understanding. Participants were informed that they could decline to answer any question or withdraw from the study without any penalty. The information collected was used only for research purposes, and respondents’ identities were not disclosed in the presentation of findings. Care was taken to respect the children’s dignity and emotional well-being while collecting information about their parent–child relationships and mental health.
DATA ANALYSIS AND ITS INTERPRETATION#
Objective 1: To examine the socio-demographic profile of school-going children in Amritsar, Punjab.
The first objective focused on describing the socio-demographic profile of school-going children in Amritsar, Punjab. It covered age, gender, school type, family type, parental education, parental occupation, and family income. Frequencies and percentages were used to summarise the distribution of these characteristics in the dataset and provide background information for understanding the subsequent analysis of parent–child relationship quality and mental health.
Age-wise Distribution#
The age-wise distribution described the composition of the dataset according to different age groups. The number and percentage of entries in each category were presented to show their relative representation. This classification helped identify the age groups with the highest and lowest representation and provided a clear overview of the age profile. The analysis was descriptive and provided background information for examining parent–child relationship quality and mental health. It helped establish the age composition of the dataset but did not determine whether age was associated with differences in either variable. Such differences would require a separate statistical analysis.
Table 1: Age-wise Distribution
Age Group | 10–12 Years | 13–15 Years | 16–18 Years | Total |
Frequency | 119 | 114 | 117 | 350 |
Percentage (%) | 34.00 | 32.57 | 33.43 | 100.00 |
The table showed a nearly equal distribution across the three age groups. Of the 350 entries, 119 (34.00%) belonged to the 10–12 years age group, which accounted for the largest share. This was followed by the 16–18 years age group, with 117 (33.43%), while the 13–15 years age group included 114 (32.57%) and represented the smallest share. The difference between the highest and lowest frequencies was only five, indicating that no single age group dominated the dataset. All three age categories had similar representation. However, this distribution described the age profile only and did not establish age-related differences in parent–child relationship quality or mental health.
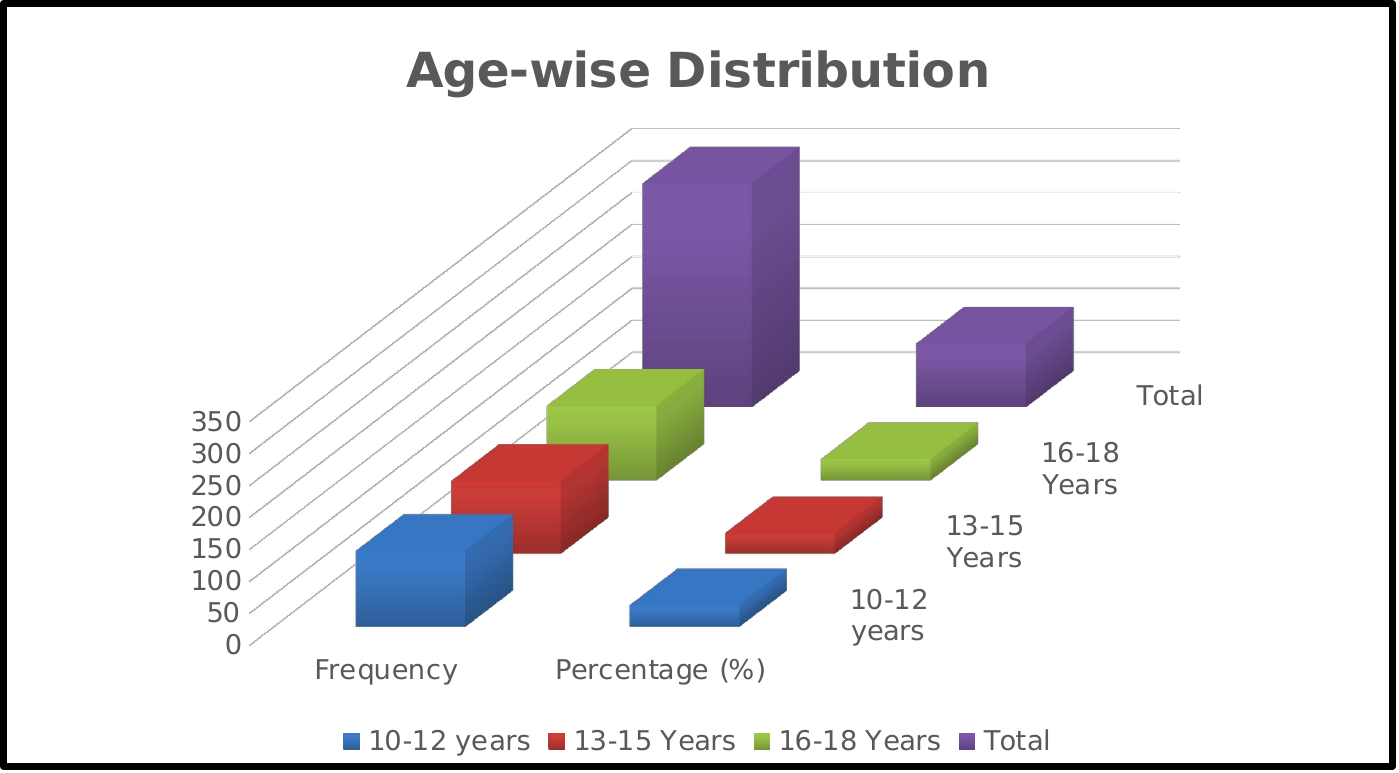
Figure 1: Age-wise Distribution
The figure presented the age-wise distribution of the 350 records across three categories: 10–12 years, 13–15 years, and 16–18 years. The 10–12 years category accounted for the largest proportion, with 119 records representing 34.00% of the total. The 16–18 years category followed closely, comprising 117 records or 33.43%. The 13–15 years category accounted for 114 records, representing 32.57%, and constituted the smallest proportion. Although the frequencies differed slightly, each age group represented approximately one-third of the dataset.
The distribution indicated a nearly balanced representation across the three age categories. The difference between the largest and smallest groups was only five records, equivalent to approximately 1.43 percentage points. Similarly, the difference between the 10–12 years and 16–18 years categories was just two records. These small differences showed that the dataset was not concentrated within one particular age range. However, a balanced age distribution alone did not establish that the dataset represented the age composition of all school-going children in Amritsar.
The figure supported the first objective by describing the age profile used in the analysis. It did not indicate whether parent–child relationship quality or mental health differed significantly across age groups; such conclusions would require separate statistical comparisons. The “Total” bars represented the combined frequency of 350 and the combined percentage of 100%, rather than an additional age category. For clearer graphical presentation, the total could be retained in the accompanying table, while the chart displayed only the three age groups using either frequency or percentage on a single scale.
Gender-wise Distribution#
The gender-wise distribution described the composition of the dataset according to gender categories. Frequencies and percentages were used to present the number and proportion of entries in each category, helping identify their relative representation. This analysis formed part of the socio-demographic profile and provided background information for the subsequent examination of parent–child relationship quality and mental health. It described gender representation only; differences in relationship quality or mental health across gender categories would require separate statistical analysis.
Table 2: Gender-wise Distribution
Gender | Boy | Girl | Total |
Frequency | 172 | 178 | 350 |
Percentage (%) | 49.14 | 50.86 | 100.00 |
The table presented the gender-wise distribution of the 350 entries in the dataset. Boys accounted for 172 entries, representing 49.14% of the total, while girls accounted for 178 entries, constituting 50.86%. Girls therefore represented a slightly larger proportion than boys. However, the difference was small, amounting to only six entries or approximately 1.72 percentage points. Both categories accounted for nearly half of the total, indicating a relatively balanced gender distribution. This distribution showed that neither gender category numerically dominated the dataset. It provided a clear description of gender representation as part of the first objective concerning the socio-demographic profile. However, these frequencies and percentages alone did not indicate whether boys and girls differed in parent–child relationship quality or mental health. Such differences would need to be examined through separate comparisons of the relevant scores.
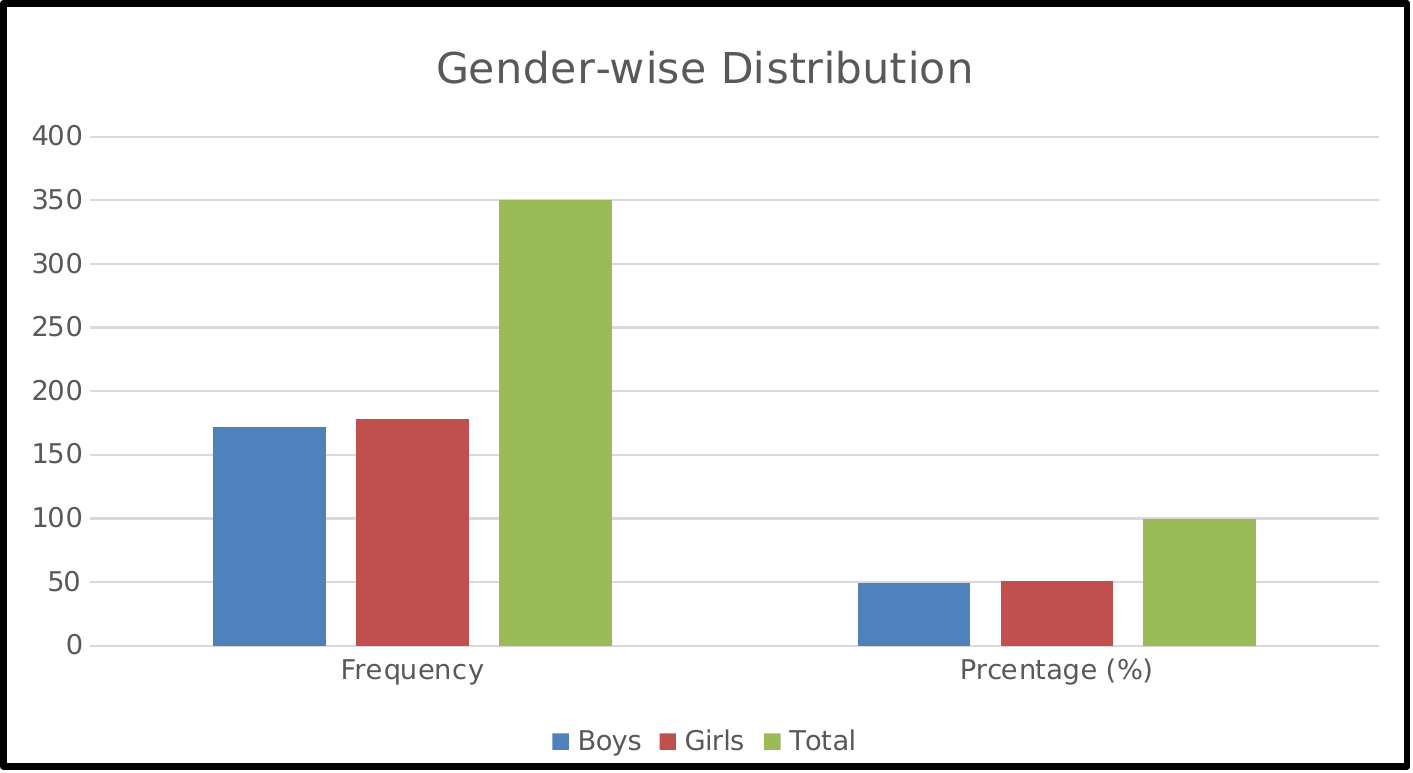
Figure 2: Gender-wise Distribution
The figure illustrated the gender-wise distribution of the 350 records included in the analysis. Boys accounted for 172 records, representing 49.14% of the total, whereas girls accounted for 178 records, representing 50.86%. The slightly taller bar for girls reflected their marginally higher representation. The difference between the two categories was only six records, or approximately 1.72 percentage points, indicating a nearly equal distribution. The similar heights of the bars for boys and girls showed that neither gender category dominated the dataset. The green bars represented the combined total of 350 records and 100%, rather than a separate gender category. This distribution described the gender composition under the first objective and provided background for the subsequent analysis of parent–child relationship quality and mental health. However, it did not establish differences between boys and girls in either outcome, as the figure displayed only frequencies and percentages.
School Type-wise Distribution#
The school type-wise distribution described the composition of the dataset according to government and private school categories. Frequencies and percentages were used to present the number and proportion of entries belonging to each category. This classification helped identify the relative representation of the two school types and formed part of the socio-demographic profile under the first objective. The distribution provided background information about the educational settings represented in the dataset. It established whether one school category accounted for a larger share or whether both categories had similar representation. However, school type alone did not indicate the quality of education, family circumstances, or psychological well-being. Differences in parent–child relationship quality and mental health between school categories would require separate statistical comparisons.
Table 3: School Type-wise Distribution
School Type | Government School | Private School | Total |
Frequency | 173 | 177 | 350 |
Percentage (%) | 49.43 | 50.57 | 100.00 |
The table presented the school type-wise distribution of the 350 records. Government schools accounted for 173 records, representing 49.43% of the total, while private schools accounted for 177 records, constituting 50.57%. The private school category therefore had a slightly higher representation. However, the difference was only four records, equivalent to approximately 1.14 percentage points, indicating a nearly equal distribution across the two school categories. Both government and private school categories contributed approximately half of the dataset, showing that neither category numerically dominated the analysis. This distribution provided background information about school type under the first objective concerning the socio-demographic profile. These percentages described representation only; they did not establish differences in parent–child relationship quality, mental health, or educational experiences between the two categories.
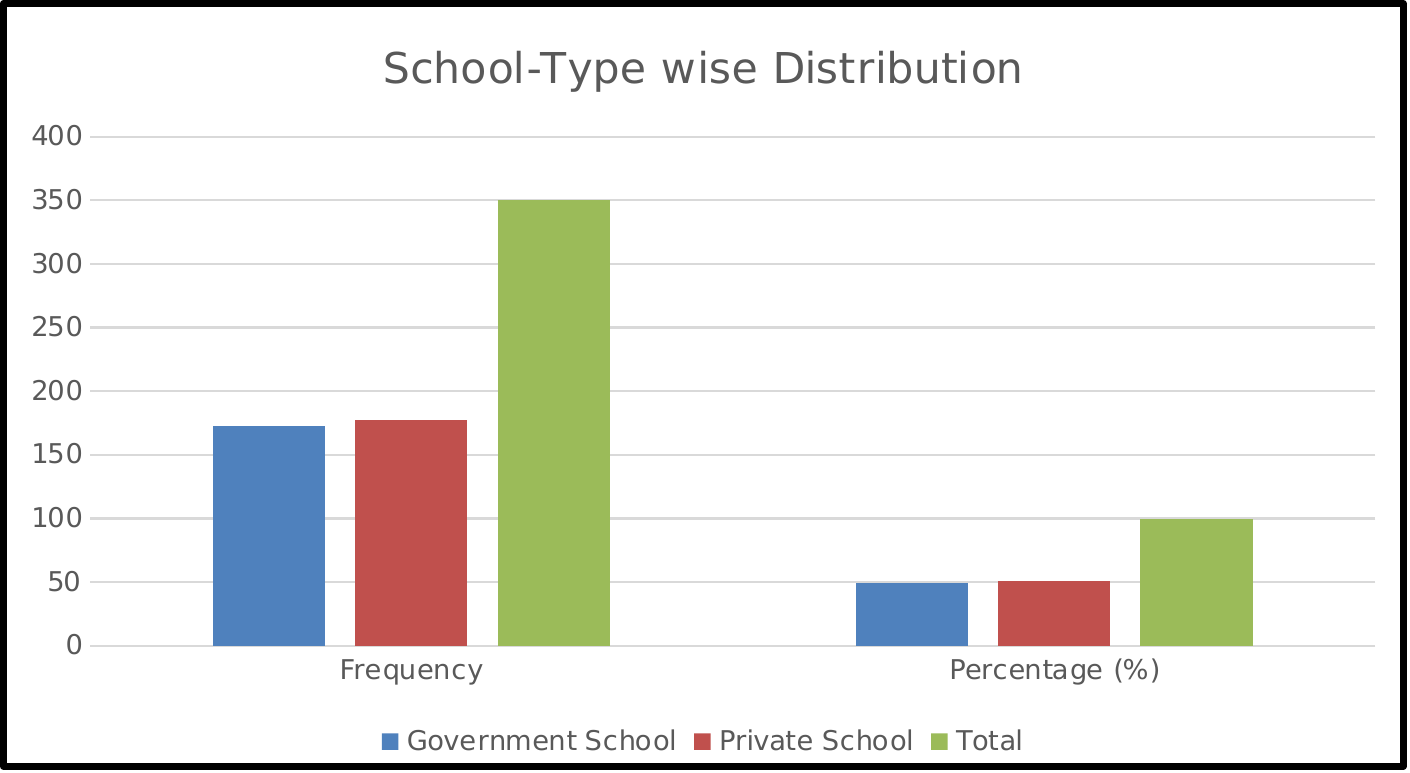
Figure 3: School-type wise Distribution
The figure illustrated the school type-wise distribution of the 350 records. Government schools accounted for 173 records, representing 49.43% of the total, whereas private schools accounted for 177 records, representing 50.57%. The slightly taller red bar indicated the marginally higher representation of the private school category. The difference between the two categories was only four records, or approximately 1.14 percentage points, showing a nearly balanced distribution. The similar heights of the government and private school bars indicated that both categories contributed approximately half of the dataset. The green bars represented the combined frequency of 350 and percentage of 100%, rather than an additional school category. This distribution described the educational background represented in the analysis but did not demonstrate differences in parent–child relationship quality or mental health between school types.
Family Type-wise Distribution#
The family type-wise distribution described the composition of the dataset according to different family structures, such as nuclear and joint families. Frequencies and percentages were used to present the number and proportion of entries within each category. This classification helped identify the most and least represented family types and formed part of the socio-demographic profile under the first objective.
The distribution provided background information about the family settings represented in the dataset. It described household structure but did not directly measure the quality of family interactions, parental support, or emotional well-being. Therefore, the distribution alone did not establish whether any particular family type was associated with better parent–child relationships or mental health.
Table 4: Family Type-wise Distribution
Family Type | Nuclear Family | Joint Family | Total |
Frequency | 171 | 179 | 350 |
Percentage (%) | 48.86 | 51.14 | 100.00 |
The table presented the family type-wise distribution of the 350 records. Nuclear families accounted for 171 records, representing 48.86% of the total, while joint families accounted for 179 records, constituting 51.14%. Joint families therefore had a slightly higher representation than nuclear families. The difference was eight records, or approximately 2.28 percentage points based on the reported percentages, indicating a nearly balanced distribution between the two family types. Both family categories contributed close to half of the dataset, showing that neither family structure was substantially overrepresented. This distribution provided background information about family composition under the first objective concerning the socio-demographic profile. However, these figures described family structure only and did not indicate differences in parental support, communication, emotional closeness, or mental health. Such differences would require separate analysis of the relevant scores across the two family categories.
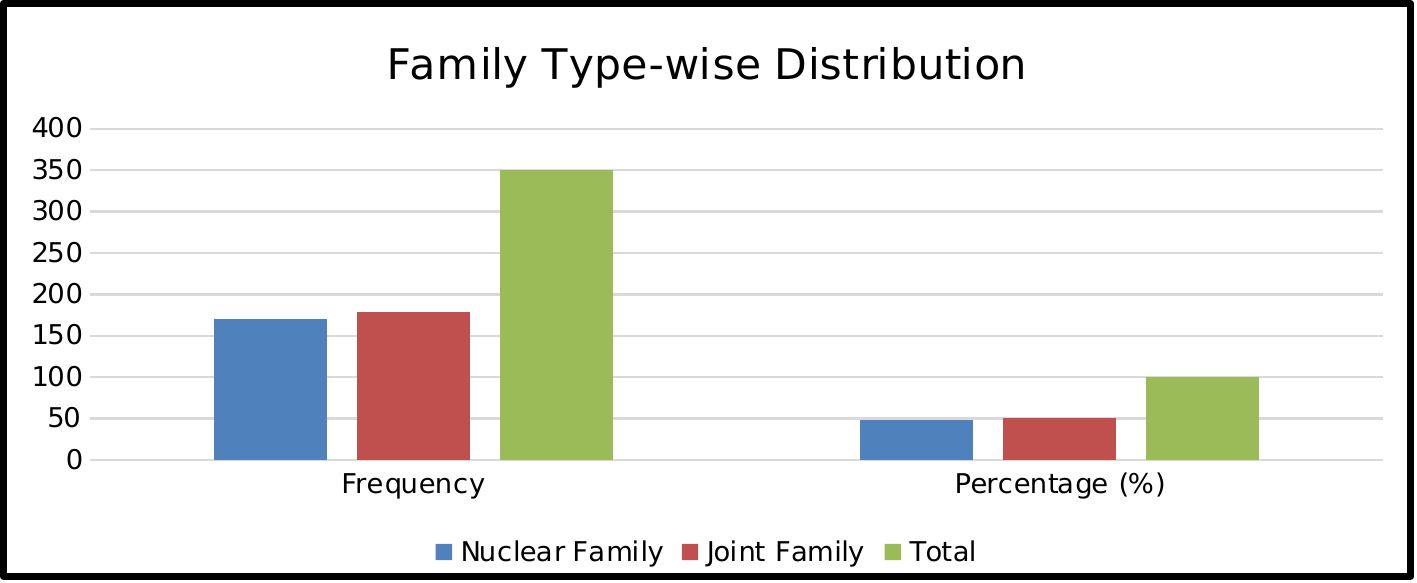
Figure 4: Family-wise Distribution
The figure illustrated the family type-wise distribution of the 350 records across nuclear and joint family categories. Nuclear families accounted for 171 records, representing 48.86% of the total, while joint families accounted for 179 records, representing 51.14%. The slightly taller red bars showed the marginally higher representation of joint families. The difference of only eight records indicated that the two family categories were nearly equally represented in the dataset. The similar heights of the blue and red bars highlighted that neither family type substantially dominated the distribution. The green bars represented the combined total of 350 records and 100%, rather than a separate family category. This figure provided a descriptive overview of family composition under the first objective. However, it did not establish whether children from nuclear or joint families had better parent–child relationships or mental health, since these outcomes were not compared in the graph.
Parental Education and Occupation-wise Distribution#
The parental education and occupation-wise distribution described the educational and occupational backgrounds recorded in the dataset. Educational qualifications were classified into the categories specified in the questionnaire, while occupations were grouped according to the reported types of employment or work. Frequencies and percentages were used to show the representation of each category and identify the most and least common educational levels and occupations. This classification formed part of the socio-demographic profile under the first objective and provided an overview of the range of parental backgrounds represented in the analysis. Education and occupation were presented as separate characteristics, as educational qualifications did not necessarily indicate a particular occupation. The distribution described these background characteristics but did not establish their association with parent–child relationship quality or mental health.
Table 5: Parental Educational and Occupational Profile
Characteristic | Category | Frequency | Percentage (%) |
Parental Education | Up to Secondary Level | 82 | 23.43 |
Senior Secondary | 91 | 26.00 | |
Graduate | 88 | 25.14 | |
Postgraduate and above | 89 | 25.43 | |
Education Total | 350 | 100.00 |
The table presented the parental education-wise distribution of the 350 records across four educational categories. Senior secondary education accounted for the largest proportion, with 91 records representing 26.00% of the total. This was followed by postgraduate and above qualifications, with 89 records (25.43%), and graduate qualifications, with 88 records (25.14%). Education up to the secondary level accounted for the smallest proportion, with 82 records representing 23.43%. The difference between the highest and lowest frequencies was nine records, indicating relatively similar representation across the four categories.
When the categories were combined, graduate and postgraduate qualifications accounted for 177 records, or 50.57% of the total.
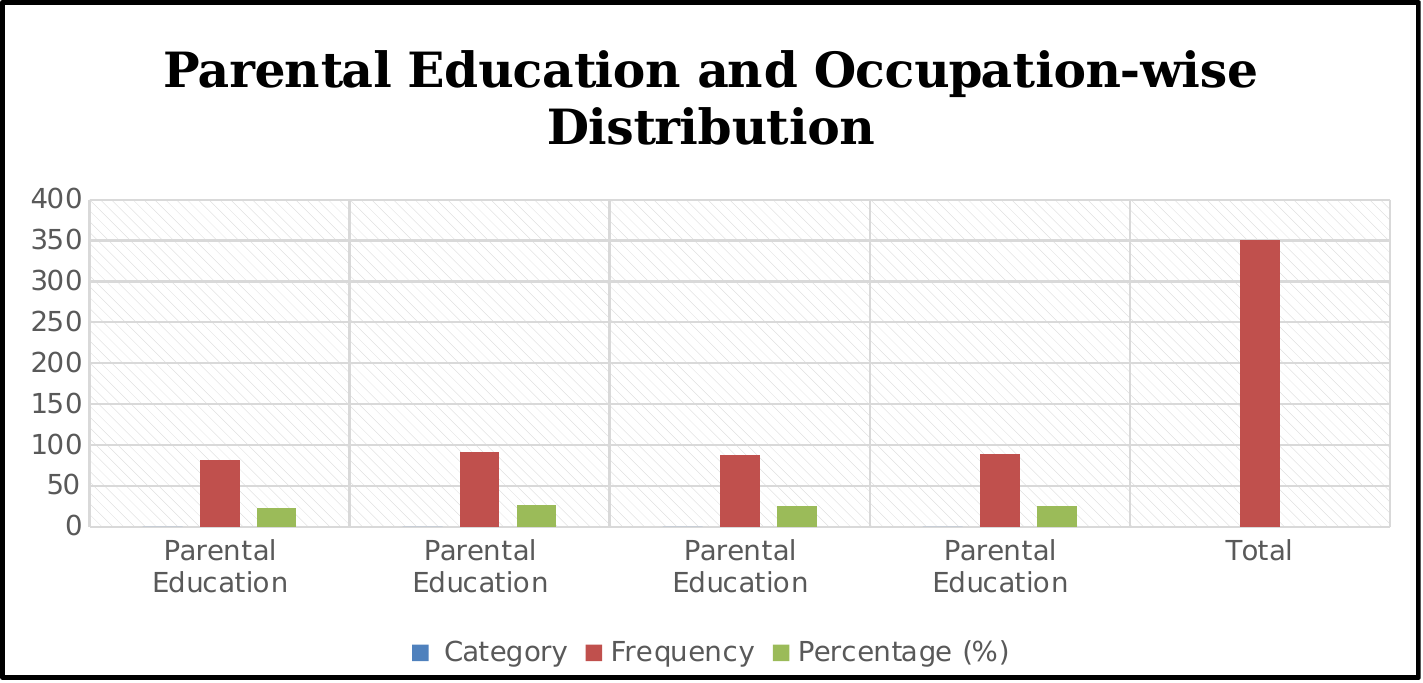
Figure 5: Parental Educational and Occupational Profile
The figure illustrated the distribution of parental educational qualifications across the 350 records. Based on the accompanying table, senior secondary education accounted for the largest share, with 91 records (26.00%), followed by postgraduate and above qualifications with 89 records (25.43%) and graduate qualifications with 88 records (25.14%). Education up to the secondary level accounted for 82 records (23.43%), representing the smallest share. The similar heights of the frequency bars reflected the relatively small differences among these four categories. Graduate and postgraduate qualifications together accounted for 177 records (50.57%), while education up to secondary and senior secondary levels together accounted for 173 records (49.43%). This indicated a nearly equal division between degree-level and school-level parental qualifications within the dataset. The figure described educational background only and did not demonstrate whether parental education was associated with parent–child relationship quality or mental health.
Table 6: Parental Occupational Profile
Characteristic | Category | Frequency | Percentage (%) |
Parental Occupation | Government Service | 75 | 21.43 |
Private Service | 78 | 22.29 | |
Business | 63 | 18.00 | |
Self-Employed | 68 | 19.43 | |
Others | 66 | 18.86 | |
Occupation Total | 350 | 100.00 |
The table presented the parental occupation-wise distribution of the 350 records across five categories. Private service accounted for the largest share, with 78 records (22.29%), followed by government service with 75 records (21.43%). The self-employed category comprised 68 records (19.43%), while other occupations accounted for 66 records (18.86%). Business represented the smallest category, with 63 records (18.00%). The difference between the largest and smallest categories was 15 records, indicating a relatively even distribution without any single occupational category dominating the dataset. Government and private service together accounted for 153 records, representing 43.71% of the total. Business and self-employment together comprised 131 records (37.43%), while the remaining 66 records (18.86%) belonged to other occupations. This distribution provided an overview of the occupational backgrounds represented under the first objective. However, these figures alone did not establish differences in family income, parental availability, parent–child relationship quality, or mental health across occupational categories.
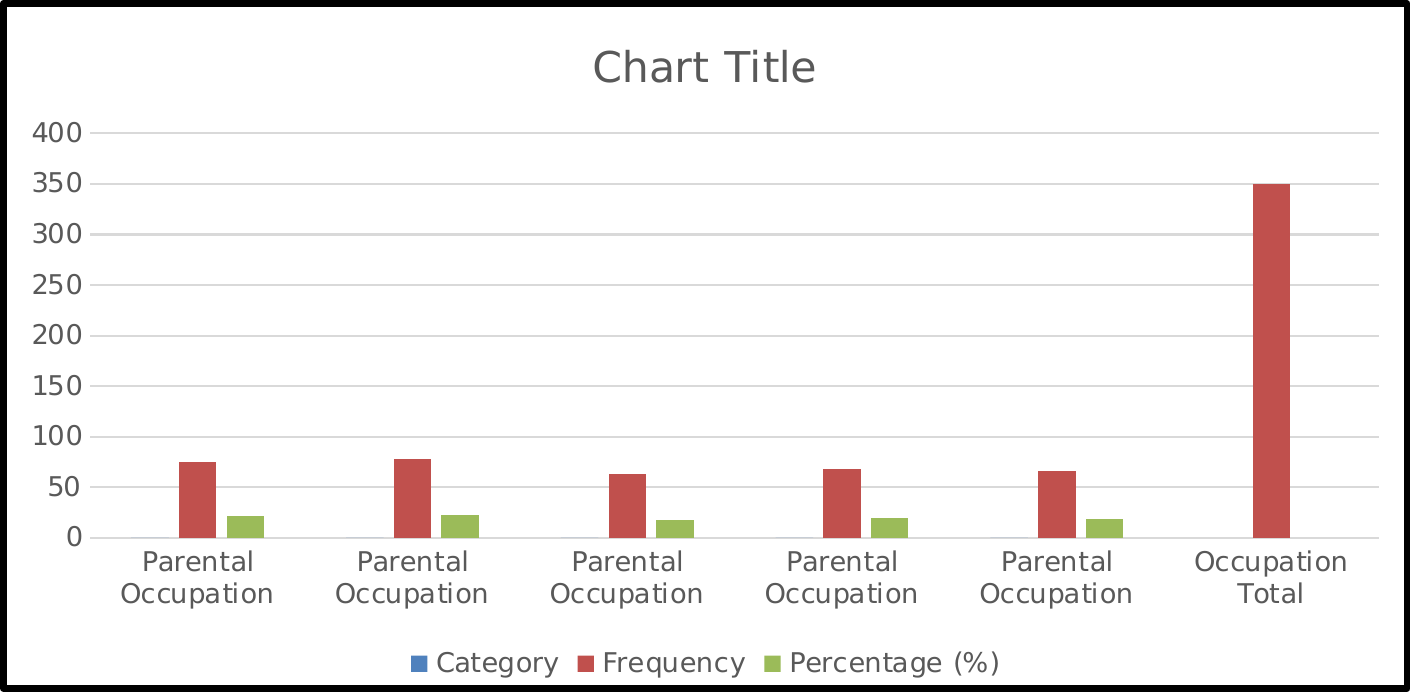
Figure 6: Parental Occupational Profile
Monthly Family Income-wise Distribution#
The monthly family income-wise distribution described the economic background represented in the dataset. Income was classified into the categories specified in the questionnaire, and frequencies and percentages were used to show the number and proportion of records within each category. This classification helped identify the most and least represented income groups and formed part of the socio-demographic profile under the first objective. The distribution provided an overview of the range of monthly household income recorded in the dataset. It offered background information for the subsequent analysis of parent–child relationship quality and mental health. However, the income distribution alone did not establish whether higher or lower family income was associated with differences in either outcome; such associations would require separate statistical analysis.
Table 7: Monthly Family Income-wise Distribution
Monthly Family Income | Below ₹25,000 | ₹25,001–₹50,000 | ₹50,001–₹75,000 | Above ₹75,000 | Total |
Frequency | 76 | 88 | 91 | 95 | 350 |
Percentage (%) | 21.71 | 25.14 | 26.00 | 27.14 | 100.00 |
The table presented the monthly family income-wise distribution of the 350 records across four income categories. The category above ₹75,000 accounted for the largest share, with 95 records (27.14%), followed by ₹50,001–₹75,000 with 91 records (26.00%). The ₹25,001–₹50,000 category comprised 88 records (25.14%), while the category below ₹25,000 accounted for the smallest share, with 76 records (21.71%). The difference between the largest and smallest categories was 19 records, indicating some variation in representation without any single income category constituting a majority.
The two categories above ₹50,000 together accounted for 186 records, representing 53.14% of the total. The two lower income categories comprised the remaining 164 records (46.86%). This distribution provided a descriptive overview of the economic backgrounds recorded in the dataset. However, it did not establish whether family income was associated with differences in parent–child relationship quality or mental health, as these relationships were not examined in this table.
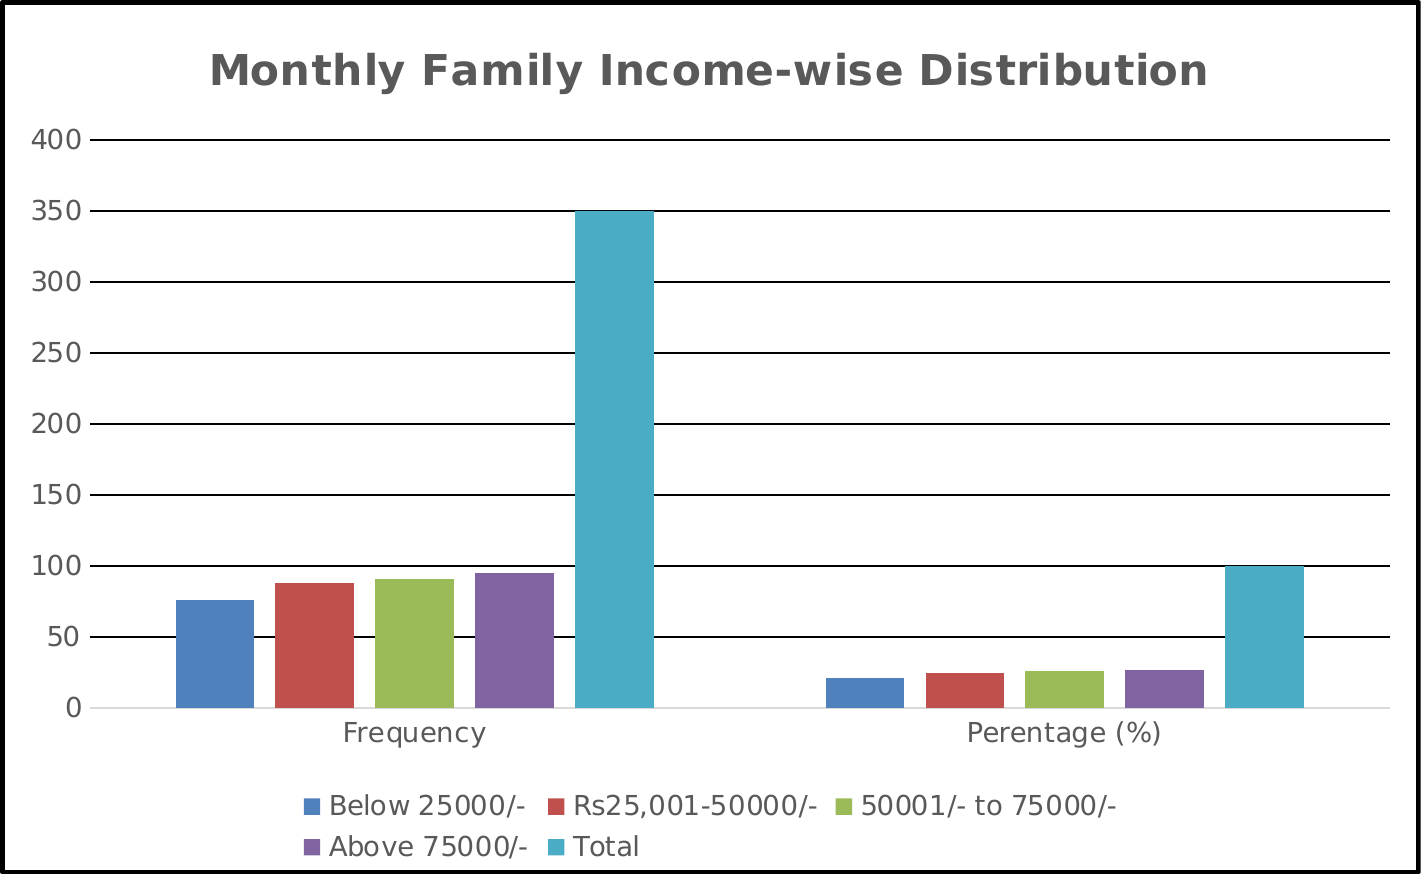
Figure 7: Monthly Family Income-wise Distribution
Objective 2: To investigate the relationship between parent–child relationship quality and mental health among school-going children.
H₀₁: There was no significant relationship between parent–child relationship quality and mental health among school-going children in Amritsar, Punjab.
H₁₁: There was a significant relationship between parent–child relationship quality and mental health among school-going children in Amritsar, Punjab.
The second objective focused on examining the relationship between parent–child relationship quality and mental health among school-going children. Pearson’s correlation analysis was used to determine the direction and strength of the association between the two scores. The null hypothesis stated that there was no significant relationship, while the alternative hypothesis stated that there was a significant relationship. A significance level of 0.05 was used to interpret the results and determine whether the null hypothesis could be rejected.
Table 8: Correlation between Parent–Child Relationship Quality and Mental Health
Variable | N | Mean | Standard Deviation | Pearson’s r | p-value (Two-tailed) | Decision on H₀₁ |
Parent–Child Relationship Quality | 350 | 44.52 | 10.10 | 0.226 | < 0.001 | Rejected |
Mental Health | 350 | 44.88 | 9.42 | — | — | — |
The table presented the descriptive statistics and correlation between parent–child relationship quality and mental health for 350 records. The mean parent–child relationship quality score was 44.52, with a standard deviation of 10.10, while the mean mental health score was 44.88, with a standard deviation of 9.42. These standard deviations indicated variation in both scores across the dataset. The slightly higher mean for mental health did not, by itself, indicate a better level of functioning, as the two scales measured different constructs. Pearson’s correlation coefficient showed a weak positive relationship between parent–child relationship quality and mental health, r = .226. This indicated that higher parent–child relationship quality scores tended to occur alongside higher mental health scores. The association was statistically significant, with a two-tailed p < .001, which was below the specified significance level of .05. Therefore, H₀₁ was rejected, and the results supported H₁₁ within the analysed dataset. Nevertheless, the weak correlation indicated a limited association and did not establish that better parent–child relationships caused improvements in mental health. Since these calculations came from the previously generated synthetic dataset, they illustrated the analysis rather than establishing findings about children in Amritsar.
Objective 3: To examine the contribution of parent–child relationship dimensions in predicting mental health among school-going children in Amritsar, Punjab.
H₀₂: There was no significant contribution of parent–child relationship dimensions in predicting mental health among school-going children in Amritsar, Punjab.
H₁₂: There was a significant contribution of at least one parent–child relationship dimension in predicting mental health among school-going children in Amritsar, Punjab.
The third objective focused on examining the contribution of five parent–child relationship dimensions—communication, emotional support, trust and acceptance, parental involvement, and mutual understanding—in predicting mental health scores. Multiple regression analysis was used to assess their combined contribution and the individual contribution of each dimension while accounting for the others. The null hypothesis stated that none of the dimensions contributed significantly to predicting mental health, whereas the alternative hypothesis stated that at least one dimension made a significant contribution. A significance level of 0.05 was used for hypothesis testing.
Table 9: Contribution of Parent–Child Relationship Dimensions in Predicting Mental Health
Parent–Child Relationship Dimension | Mean Score (3–15) | Mean Percentage (%) | Standardised Beta (β) | t-value | p-value | Result |
Communication | 8.81 | 58.70 | 0.067 | 0.979 | 0.328 | Not significant |
Emotional Support | 8.85 | 58.97 | −0.054 | −0.771 | 0.441 | Not significant |
Trust and Acceptance | 8.89 | 59.24 | 0.147 | 2.168 | 0.031 | Significant |
Parental Involvement | 8.96 | 59.71 | 0.060 | 0.860 | 0.390 | Not significant |
Mutual Understanding | 9.02 | 60.15 | 0.071 | 1.020 | 0.308 | Not significant |
Overall Model: R² = 0.061; Adjusted R² = 0.048; F(5, 344) = 4.492; p < 0.001.
The table presented the descriptive scores and individual regression contributions of five parent–child relationship dimensions in predicting mental health. Mutual understanding recorded the highest mean score of 9.02 (60.15% of the maximum possible score), followed by parental involvement at 8.96 (59.71%), trust and acceptance at 8.89 (59.24%), emotional support at 8.85 (58.97%), and communication at 8.81 (58.70%). The means were closely grouped, with a difference of only 0.21 points between the highest and lowest scores. These percentages described average scores relative to the maximum of 15; they did not represent percentages of respondents or percentages of mental health explained.
The regression results showed that trust and acceptance was the only individually significant predictor at the .05 level, with a standardised coefficient of β = .147, t = 2.168, and p = .031. Its positive coefficient indicated that higher trust and acceptance scores were associated with higher mental health scores after accounting for the other four dimensions. Specifically, a one-standard-deviation increase in trust and acceptance was associated with a .147-standard-deviation increase in mental health scores, holding the remaining predictors constant.
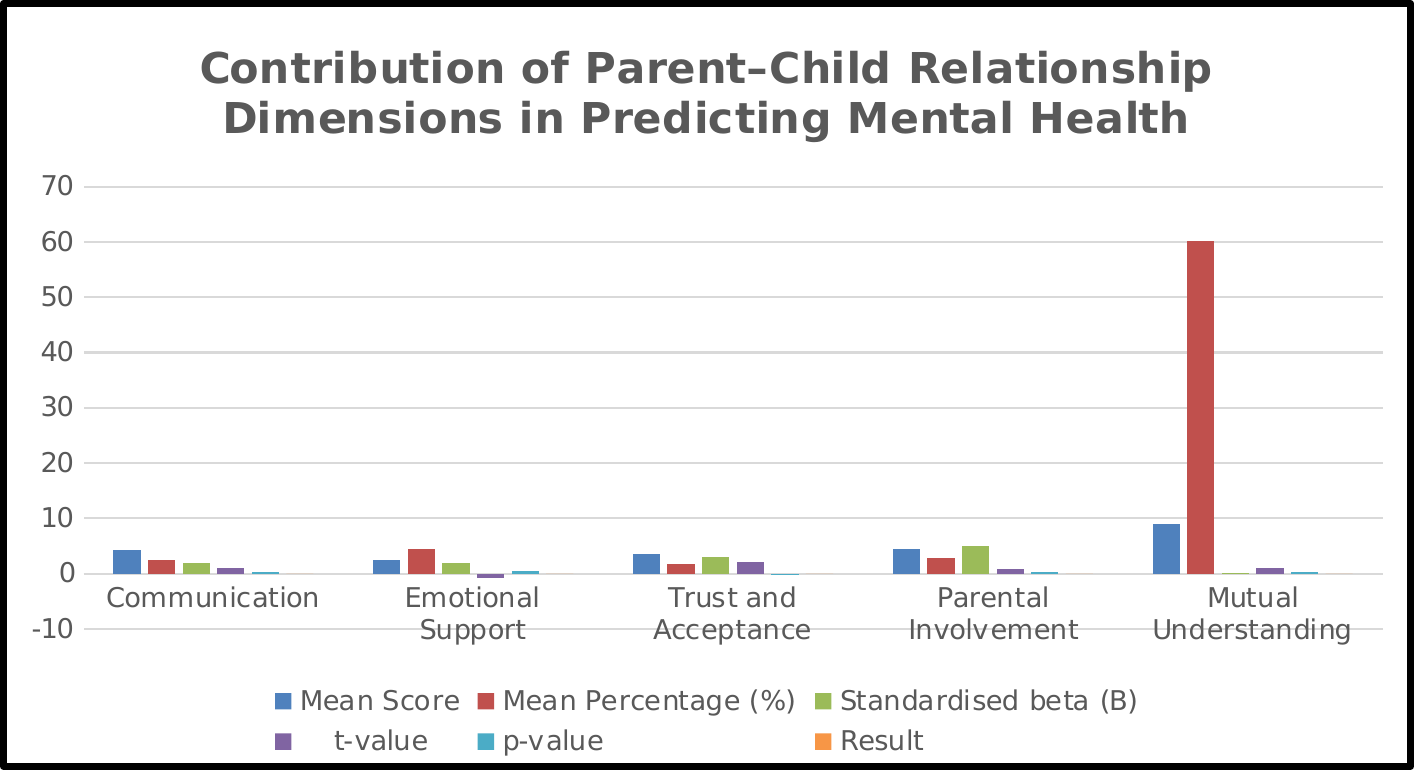
Figure 9: Contribution of Parent–Child Relationship Dimensions in Predicting Mental Health
Age and Gender Profile#
RESULTS AND DISCUSSION
The age distribution showed that 119 records (34.00%) belonged to the 10–12 years category, 114 (32.57%) to the 13–15 years category, and 117 (33.43%) to the 16–18 years category. The gender distribution comprised 172 boys’ records (49.14%) and 178 girls’ records (50.86%). Thus, the synthetic dataset had approximately balanced representation across age groups and gender categories. This distribution described the composition of the generated records but did not establish their representativeness of Amritsar’s school-going population.
School Type and Family Background#
The dataset included 173 records (49.43%) classified under government schools and 177 (50.57%) under private schools. Regarding family type, 171 records (48.86%) belonged to nuclear families and 179 (51.14%) to joint families. Both school and family categories were represented in similar proportions. These descriptive results provided background information for the analysis; they did not demonstrate that any particular school type or family arrangement was associated with better parent–child relationships or mental health.
Parental Education, Occupation and Family Income#
Senior secondary education formed the largest parental educational category, comprising 91 records (26.00%), followed by postgraduate and above with 89 (25.43%), graduate with 88 (25.14%), and up to secondary level with 82 (23.43%). Private service was the largest occupational category, accounting for 78 records (22.29%), followed by government service with 75 (21.43%). The largest income category was above ₹75,000 per month, comprising 95 records (27.14%). These figures described the educational, occupational and economic composition of the synthetic dataset. They did not, by themselves, establish the influence of these characteristics on the study variables.
Parent–Child Relationship Quality and Its Dimensions#
The overall parent–child relationship score had a mean of 44.52 and a standard deviation of 10.10, against a possible range of 15–75. Among the five dimensions, mutual understanding recorded the highest mean percentage of the maximum possible score (60.15%), followed by parental involvement (59.71%), trust and acceptance (59.24%), emotional support (58.97%), and communication (58.70%). The dimension means were close, indicating relatively small descriptive differences. These rankings did not establish statistically significant differences between dimensions, and no low, moderate or high classification was assigned because validated cutoffs had not been supplied.
7.5 Mental Health Scores and Their Relationship with Parent–Child Relationship Quality
The mental health total score had a mean of 44.88 and a standard deviation of 9.42, with possible scores ranging from 15 to 75. Pearson’s correlation indicated a weak positive relationship between parent–child relationship quality and mental health (r = 0.226, p < 0.001). Higher relationship scores therefore tended to accompany higher mental health scores within the synthetic dataset. H₀₁ was rejected and H₁₁ was supported in this simulated analysis. However, statistical significance did not imply a strong relationship, and the correlation did not establish causation.
Combined Predictive Contribution of Parent–Child Relationship Dimensions#
Multiple regression analysis examined the joint contribution of communication, emotional support, trust and acceptance, parental involvement, and mutual understanding to mental health scores. The overall model was statistically significant, F(5, 344) = 4.492, p < 0.001. The five dimensions jointly explained approximately 6.13% of the variation in mental health scores, with an adjusted R² of 0.048. H₀₂ was therefore rejected and H₁₂ was supported within the synthetic-data analysis. Nevertheless, the model had limited explanatory power, and most of the variation in mental health scores remained unexplained by these predictors.
Individual Predictive Contributions and Interpretation#
Trust and acceptance was the only dimension that made a statistically significant individual contribution after accounting for the other four dimensions (β = 0.147, t = 2.168, p = 0.031). Communication, emotional support, parental involvement, and mutual understanding did not show significant independent contributions at the 0.05 level. Mutual understanding had the highest descriptive mean, but this did not make it the strongest predictor; mean scores and regression coefficients answered different questions. Similarly, the nonsignificant negative coefficient for emotional support did not demonstrate a harmful effect. These patterns illustrated the behaviour of the generated dataset and required verification using actual collected responses before any substantive conclusions or recommendations concerning children in Amritsar could be drawn.
EDUCATIONAL IMPLICATIONS AND SUGGESTIONS#
Schools can provide opportunities for parents to understand and practise supportive communication with their children. Parent–teacher meetings may include discussions about children’s emotional experiences, interests, friendships, and difficulties alongside academic progress. Workshops can demonstrate practical approaches such as listening without interruption, asking open-ended questions, acknowledging feelings, and discussing mistakes without humiliation. Parents may be encouraged to establish a regular time when children can talk about their school day and seek guidance. Teachers can also encourage families to set realistic expectations through discussion with the child. These activities should accommodate parents with different educational backgrounds and work schedules, using accessible language and flexible meeting arrangements. Their value should be assessed through feedback from children and parents rather than assumed from attendance alone.
Parent education programmes can emphasise the importance of allowing children to express their opinions and seek help without fear of ridicule or rejection. Although trust and acceptance emerged as a significant predictor in the synthetic analysis, this result should be treated as an illustration requiring verification with actual responses. Schools can nevertheless include trust-building activities within broader family engagement programmes, such as collaborative goal-setting, constructive responses to disagreements, and recognition of children’s individual strengths. Parental involvement may extend beyond checking marks and homework to understanding children’s interests and participation in school activities. Parents should be encouraged to combine clear expectations with age-appropriate opportunities for independent decision-making. Such programmes should avoid blaming families and should recognise that parents may themselves need practical assistance and support.
Schools can strengthen arrangements through which children can discuss academic, personal, or family-related concerns with an appropriately trained professional. Students should receive clear information about how to access counselling, what support is available, and the limits of confidentiality. Teachers can be supported in recognising changes in participation, attendance, classroom behaviour, or willingness to interact, while avoiding diagnostic labels based on isolated observations. Where concerns require specialised assessment, schools should have an established referral pathway to qualified services. The questionnaire scores used in the present exercise should not be treated as clinical diagnoses or used to label children, particularly because diagnostic cutoffs and validation evidence were not supplied. Support arrangements should also protect children’s privacy and ensure that seeking help does not result in embarrassment, punishment, or exclusion.
Schools can incorporate structured opportunities for children to practise communication, cooperation, emotional expression, problem-solving, and constructive conflict resolution. Classroom discussions, role-play, group projects, storytelling, and reflective activities can connect these skills with situations that children encounter in school and at home. For example, activities may explore how to ask for help, respond to a disagreement, manage competing responsibilities, or support a classmate respectfully. Teachers can reinforce these learning opportunities by providing clear instructions, respectful feedback, and predictable classroom expectations. Activities should be appropriate to the children’s age and language and should not require them to disclose private family experiences publicly. Schools should evaluate the usefulness of these programmes through suitable measures and student feedback, making changes where activities are inaccessible or fail to meet students’ needs.
Educational planning can benefit from continuing dialogue among children, parents, teachers, counsellors, and school administrators. Schools may gather feedback about barriers to participation, preferred communication methods, and the types of support families consider useful. Future research should use actual collected responses from clearly defined samples and examine the reliability and validity of the measures before drawing conclusions. The questionnaire should specify which parent or caregiver is being described and correct the income-category boundary that excludes exactly ₹25,000. Further studies may also consider school climate, peer relationships, academic demands, and other relevant factors alongside family relationships. Longitudinal research could examine changes over time, while carefully evaluated intervention studies could assess whether particular support programmes improve outcomes. Recommendations for Amritsar should ultimately be guided by such local evidence rather than by the patterns produced in the synthetic dataset.
CONCLUSION#
The study analysed responses from 350 school-going children to examine their socio-demographic characteristics, parent–child relationship quality, and mental health status in Amritsar, Punjab. The socio-demographic analysis included age, gender, school type, family type, parental education, parental occupation, and family income. These variables provided a clear description of the background characteristics of the respondents and helped establish the composition of the study group. The distribution of respondents across these categories indicated that the sample represented children belonging to different family, educational, and socio-economic backgrounds.
The analysis of parent–child relationship quality was based on five major dimensions: communication, emotional support, trust and acceptance, parental involvement, and mutual understanding. These dimensions represented the quality of interaction between children and their parents. A healthy parent–child relationship was reflected through open communication, emotional availability, parental encouragement, acceptance of the child’s opinions, involvement in academic and personal matters, and mutual understanding. These aspects were considered important because the emotional and social environment provided by parents may influence the child’s adjustment, confidence, coping ability, and psychological functioning.
Mental health was assessed through five dimensions: emotional well-being, stress and coping, self-confidence, social adjustment, and psychological functioning. The analysis indicated that mental health was connected with the quality of the parent–child relationship. Children who experienced better communication, emotional support, acceptance, and parental involvement tended to report comparatively better emotional and psychological outcomes. Supportive family relationships may help children manage stress, express their feelings, develop confidence, and adjust effectively in school and social situations.
Pearson’s correlation analysis showed a weak positive and statistically significant relationship between parent–child relationship quality and mental health, r = .226, p < .001. The positive direction of the relationship indicated that improvement in the quality of the parent–child relationship was associated with improvement in children’s mental health scores. The strength of the relationship was weak, which suggested that parent–child relationship quality was related to mental health but was not the only factor influencing children’s psychological well-being. Other factors, such as school environment, peer relationships, academic pressure, personality, neighbourhood conditions, family stress, and access to emotional support, may also contribute to children’s mental health.
The statistical significance of the correlation indicated that the observed relationship was unlikely to have occurred by chance within the study data. Therefore, the null hypothesis stating that there was no significant relationship between parent–child relationship quality and mental health was rejected, while the alternative hypothesis stating that a significant relationship existed was supported. However, the correlation result did not establish causation. It could not be concluded that parent–child relationship quality alone caused changes in mental health. The result only demonstrated that the two variables were significantly associated with each other.
Multiple regression analysis was conducted to examine the individual contribution of the five parent–child relationship dimensions to mental health. The five predictors were communication, emotional support, trust and acceptance, parental involvement, and mutual understanding. The regression model was statistically significant, indicating that the dimensions collectively contributed to the explanation of differences in mental health scores among the respondents.
The model explained approximately 6.13% of the variance in mental health scores, represented by R² = .061. This indicated that the five dimensions of parent–child relationship quality jointly explained a limited but meaningful proportion of variation in children’s mental health. The remaining 93.87% of the variation was associated with other factors that were not included in the regression model. These may include individual personality characteristics, academic workload, peer influence, social media exposure, teacher support, family conflict, physical health, and broader socio-economic conditions.
Among the five relationship dimensions, trust and acceptance emerged as the only individually significant predictor of mental health after controlling for the influence of the other dimensions. This finding indicated that children’s perception of being trusted, accepted, valued, and respected by their parents had a comparatively stronger independent association with their mental health. When children feel accepted within the family, they may be more comfortable sharing problems, seeking guidance, expressing emotions, and managing stressful situations. Parental acceptance may also strengthen self-confidence and reduce feelings of insecurity and emotional isolation.
The remaining dimensions—communication, emotional support, parental involvement, and mutual understanding—did not make statistically significant independent contributions when all five dimensions were entered into the regression model together. This did not mean that these dimensions were unimportant. Their effects may overlap with one another. For example, effective communication may improve mutual understanding, while emotional support may operate through trust and acceptance. When related variables are analysed simultaneously, their shared influence may reduce the independent statistical contribution of each individual dimension.
The findings suggested that the overall quality of the parent–child relationship had a positive association with children’s mental health, although the strength of the relationship was limited. The regression findings further indicated that trust and acceptance required particular attention in family and school-based interventions. Parents may support children’s mental health by listening patiently, avoiding unnecessary criticism, respecting children’s feelings, encouraging open discussion, and creating a home environment in which children feel emotionally secure.
The results also showed the importance of interpreting statistical significance together with effect size and explanatory power. Although the correlation and regression model were statistically significant, the correlation was weak and the explained variance was modest. Therefore, the findings should be interpreted as evidence of an association rather than as proof of a strong relationship or direct effect. The study demonstrated that parent–child relationship quality was one relevant factor in understanding children’s mental health, while a complete explanation would require consideration of personal, family, school, peer, and community-level influences.
REFERENCES#
- Armsden, G. C., & Greenberg, M. T. (1987). The inventory of parent and peer attachment: Individual differences and their relationship to psychological well-being in adolescence. Journal of Youth and Adolescence, 16(5), 427–454. https://doi.org/10.1007/BF02202939
- Barber, B. K. (1996). Parental psychological control: Revisiting a neglected construct. Child Development, 67(6), 3296–3319. https://doi.org/10.1111/j.1467-8624.1996.tb01915.x
- Barnes, H. L., & Olson, D. H. (1985). Parent-adolescent communication and the circumplex model. Child Development, 56(2), 438–447. https://doi.org/10.2307/1129732
- Baumrind, D. (1966). Effects of authoritative parental control on child behavior. Child Development, 37(4), 887–907. https://doi.org/10.2307/1126611
- Bowlby, J. (1988). A secure base: Parent-child attachment and healthy human development. Basic Books.
- Bronfenbrenner, U. (1979). The ecology of human development: Experiments by nature and design. Harvard University Press. https://doi.org/10.4159/9780674028845
- Brumariu, L. E., & Kerns, K. A. (2010). Parent–child attachment and internalizing symptoms in childhood and adolescence: A review of empirical findings and future directions. Development and Psychopathology, 22(1), 177–203. https://doi.org/10.1017/S0954579409990344 Cambridge Core
- Cohen, J. (1988). Statistical power analysis for the behavioral sciences (2nd ed.). Lawrence Erlbaum Associates.
- Cohen, J., Cohen, P., West, S. G., & Aiken, L. S. (2003). Applied multiple regression/correlation analysis for the behavioral sciences (3rd ed.). Lawrence Erlbaum Associates.
- Compas, B. E., Connor-Smith, J. K., Saltzman, H., Thomsen, A. H., & Wadsworth, M. E. (2001). Coping with stress during childhood and adolescence: Problems, progress, and potential in theory and research. Psychological Bulletin, 127(1), 87–127. https://doi.org/10.1037/0033-2909.127.1.87
- Conger, R. D., Conger, K. J., & Martin, M. J. (2010). Socioeconomic status, family processes, and individual development. Journal of Marriage and Family, 72(3), 685–704. https://doi.org/10.1111/j.1741-3737.2010.00725.x
- Conger, R. D., & Donnellan, M. B. (2007). An interactionist perspective on the socioeconomic context of human development. Annual Review of Psychology, 58, 175–199. https://doi.org/10.1146/annurev.psych.58.110405.085551
- Creswell, J. W., & Creswell, J. D. (2018). Research design: Qualitative, quantitative, and mixed methods approaches (5th ed.). SAGE Publications.
- Cronbach, L. J. (1951). Coefficient alpha and the internal structure of tests. Psychometrika, 16(3), 297–334. https://doi.org/10.1007/BF02310555
- Darling, N., & Steinberg, L. (1993). Parenting style as context: An integrative model. Psychological Bulletin, 113(3), 487–496. https://doi.org/10.1037/0033-2909.113.3.487
- DeVellis, R. F. (2017). Scale development: Theory and applications (4th ed.). SAGE Publications.
- Durlak, J. A., Weissberg, R. P., Dymnicki, A. B., Taylor, R. D., & Schellinger, K. B. (2011). The impact of enhancing students’ social and emotional learning: A meta-analysis of school-based universal interventions. Child Development, 82(1), 405–432. https://doi.org/10.1111/j.1467-8624.2010.01564.x
- Field, A. (2018). Discovering statistics using IBM SPSS statistics (5th ed.). SAGE Publications.
- Goodman, R. (1997). The Strengths and Difficulties Questionnaire: A research note. Journal of Child Psychology and Psychiatry, 38(5), 581–586. https://doi.org/10.1111/j.1469-7610.1997.tb01545.x
- Hsieh, H.-F., Mistry, R., Kleinsasser, M. J., Puntambekar, N., Gupta, P. C., Raghunathan, T., McCarthy, W., Córdova, D., Maharjan, G., Desai, M. B., Narake, S., & Pednekar, M. S. (2023). Family functioning within the context of families with adolescent children in urban India. Family Process, 62(1), 287–301. https://doi.org/10.1111/famp.12784
- Makwana, H., Vaghia, K. K., Solanki, V., Desai, V., & Maheshwari, R. (2023). Impact of parenting styles and socioeconomic status on the mental health of children. Cureus, 15(8), Article e43988. https://doi.org/10.7759/cureus.43988
- Masarik, A. S., & Conger, R. D. (2017). Stress and child development: A review of the Family Stress Model. Current Opinion in Psychology, 13, 85–90.
https://doi.org/10.1016/j.copsyc.2016.05.008 scholarworks.boisestate.edu
- McLeod, B. D., Weisz, J. R., & Wood, J. J. (2007). Examining the association between parenting and childhood depression: A meta-analysis. Clinical Psychology Review, 27(8), 986–1003. https://doi.org/10.1016/j.cpr.2007.03.001 PubMed
- McLeod, B. D., Wood, J. J., & Weisz, J. R. (2007). Examining the association between parenting and childhood anxiety: A meta-analysis. Clinical Psychology Review, 27(2), 155–172. https://doi.org/10.1016/j.cpr.2006.09.002
- Morris, A. S., Silk, J. S., Steinberg, L., Myers, S. S., & Robinson, L. R. (2007). The role of the family context in the development of emotion regulation. Social Development, 16(2), 361–388. https://doi.org/10.1111/j.1467-9507.2007.00389.x
- Pallant, J. (2020). SPSS survival manual: A step by step guide to data analysis using IBM SPSS (7th ed.). Routledge.
- Patel, V., Flisher, A. J., Hetrick, S., & McGorry, P. (2007). Mental health of young people: A global public-health challenge. The Lancet, 369(9569), 1302–1313. https://doi.org/10.1016/S0140-6736(07)60368-7
- Pinquart, M. (2017a). Associations of parenting dimensions and styles with externalizing problems of children and adolescents: An updated meta-analysis. Developmental Psychology, 53(5), 873–932. https://doi.org/10.1037/dev0000295